Applied Browser Projects
CSV Canvas Dashboard
CSV data is filtered in JavaScript and then drawn as bars on a canvas, producing replay frames for data and graphics together.
Program
Applied browser examples combine data parsing and visual output. The keyframes track the data table shrinking before the chart changes.
csv_canvas_dashboard.html
Visuals: captured from real browser rendering
<canvas id="chart" width="320" height="180"></canvas>
<script>
  const chart = document.querySelector("#chart");
  const csv = "day,status,count\nMon,open,4\nTue,done,3\nWed,open,6";
  const rows = csv.split("\n").slice(1).map(line => line.split(","));
  const openRows = rows.filter(row => row[1] === "open");
  const ctx = chart.getContext("2d");
  openRows.forEach((row, index) => {
    const count = Number(row[2]);
    ctx.fillRect(30 + index * 80, 140 - count * 16, 48, count * 16);
  });
</script>
Start from CSV text.
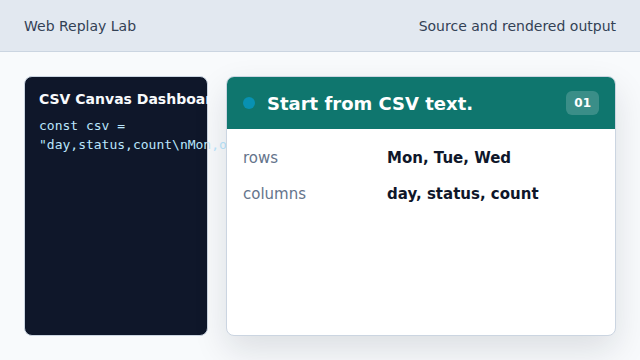
The example begins with a small inline dataset. Split CSV into rows.
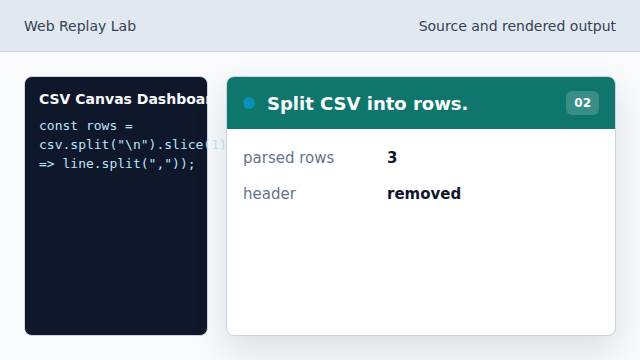
Rows become arrays that JavaScript can filter. Keep only open rows.
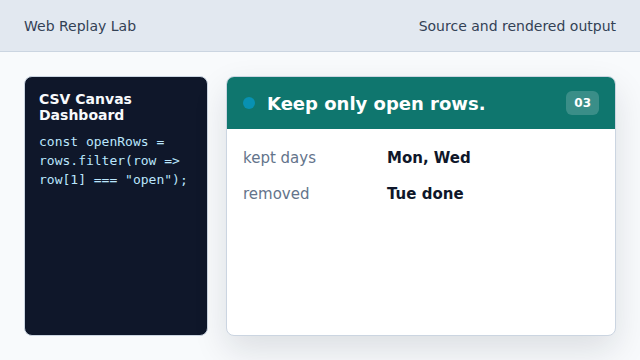
The chart only uses rows whose status is open. Prepare canvas drawing.
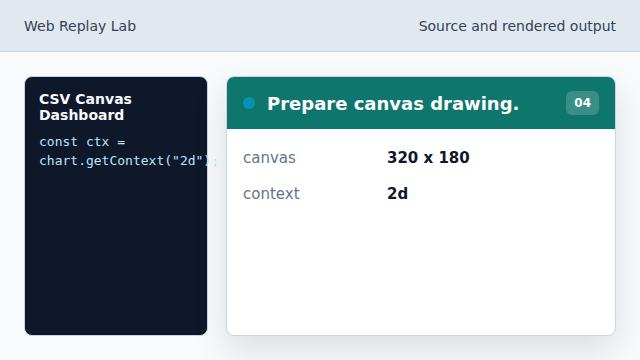
The data is ready to become pixels. Convert the count text to a number.
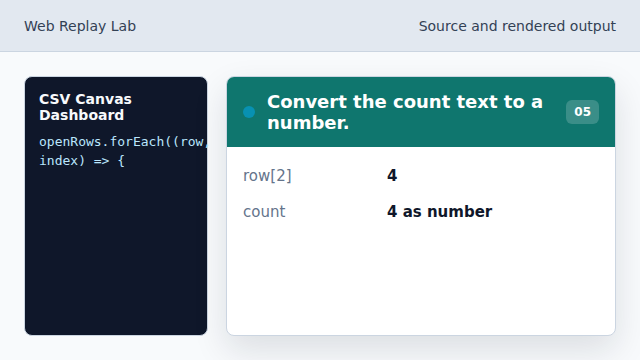
Canvas dimensions use numeric values, so the CSV count is converted explicitly. Draw one bar per open row.
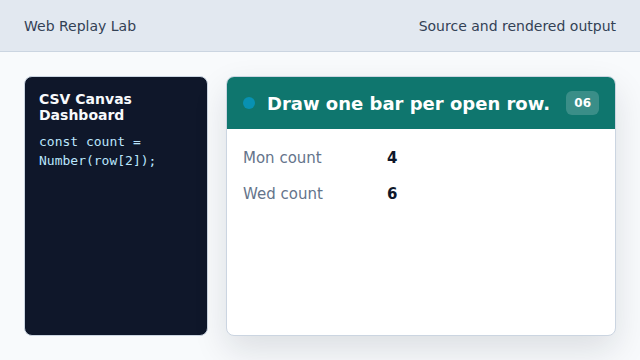
Bar heights come from the filtered count values.
data keyframes
The replay can show parsed rows, filtered rows, and the rendered chart as separate steps.
canvas chart
Canvas draws chart pixels from numeric data.