Embedded Media
Inline SVG Title
Graphics Inside HTML
A small chart uses SVG elements directly in HTML so the browser can render shapes and expose a graphic title.
Program
SVG markup can live inside HTML. The same replay model can highlight each element as the browser builds a graphic from declarative shapes.
inline_svg_title.html
Visuals: captured from real browser rendering
<svg role="img" aria-labelledby="chart-title" viewBox="0 0 160 90">
  <title id="chart-title">Signups increased</title>
  <rect width="50" height="40" x="20" y="40"></rect>
  <rect width="50" height="70" x="90" y="10"></rect>
</svg>
Create the SVG viewport.
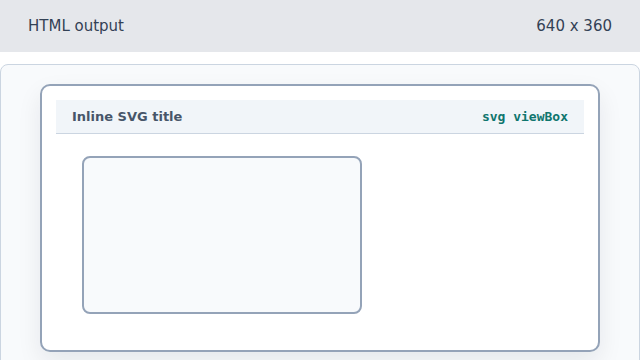
The svg element creates a coordinate system for the graphic. Name the graphic.
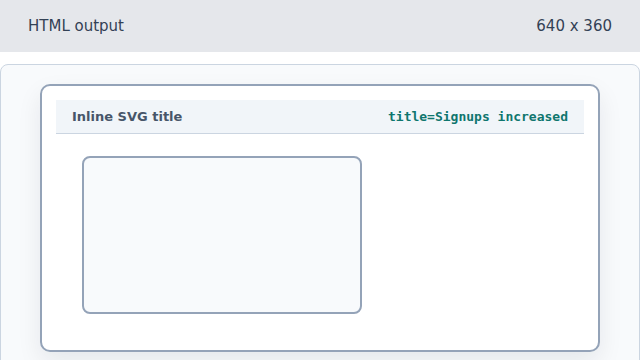
The title element names the whole graphic. Draw the first bar.
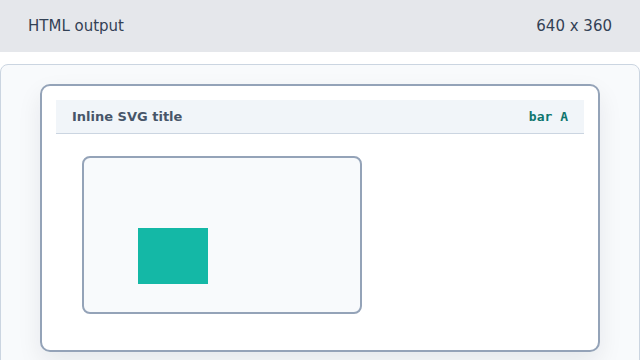
The first rect is a visible shape in the SVG coordinate system. Draw the taller second bar.
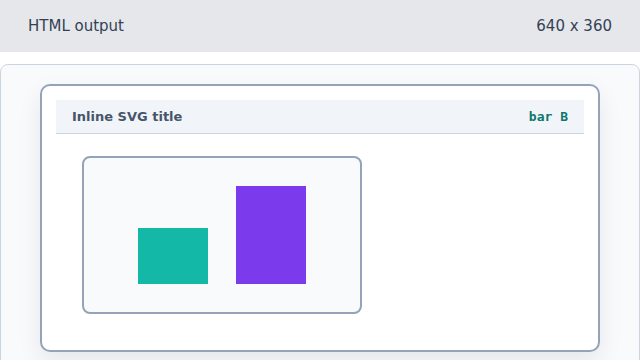
The second rect makes the increase visible.
inline SVG
Inline SVG is parsed as markup instead of loaded as a separate bitmap file.
accessible title
An SVG title can name the graphic when aria-labelledby points to it.