ViewBox Text and Gradients
Path Curve Label
A curved path, endpoint markers, and text label make an SVG trend line readable without bitmap images.
Program
The path element can draw curves with compact commands. Labels and markers turn the path into an understandable chart element.
path_curve_label.html
Visuals: captured from real browser rendering
<svg viewBox="0 0 160 90" width="320" height="180" role="img" aria-label="Rising trend">
  <path d="M20 70 C55 20, 95 80, 140 24" fill="none" stroke="#2563eb" stroke-width="6"/>
  <circle cx="20" cy="70" r="5" fill="#1e293b"/>
  <circle cx="140" cy="24" r="5" fill="#1e293b"/>
  <text x="92" y="20" font-size="12" fill="#0f172a">growth</text>
</svg>
Create chart coordinates.
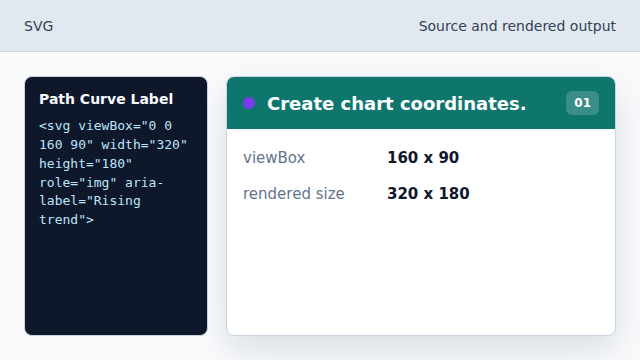
All marks use the same SVG coordinate system. Draw a cubic curve.
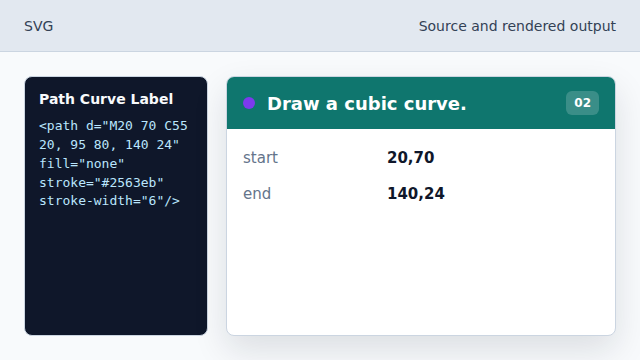
The C command uses two control points and one end point. Make the curve visible.
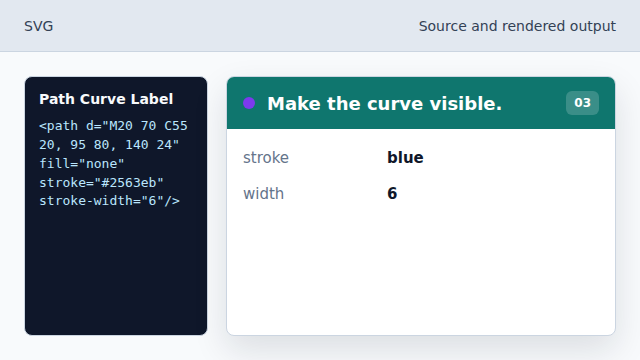
A thicker stroke makes the trend readable at small sizes. Mark the start point.
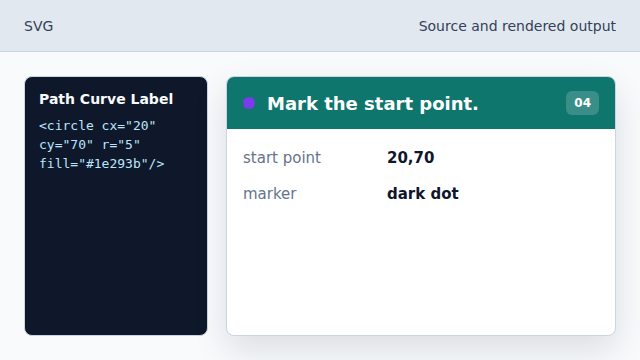
A circle anchors where the trend begins. Add a text label.
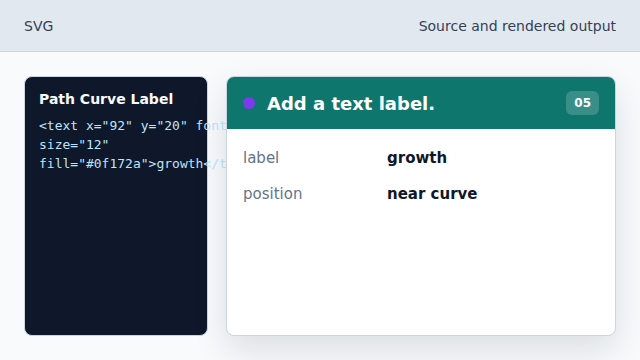
The label describes the path inside the graphic.
path
path draws complex shapes from commands such as M, L, C, and Z.
text
SVG text places readable labels in the same coordinate space as shapes.