Data Visualization Patterns
Metric Sparkline
A static metric card shows Orders: 42, a tiny inline SVG sparkline, and a text summary from pinned data.
Program
A small dashboard card can pair a visual trend with a plain text summary. This lesson uses fixed values and no live analytics.
metric_sparkline_summary.html
Visuals: captured from real browser rendering
<section class="metric-card" aria-labelledby="orders-title">
  <h2 id="orders-title">Orders: 42</h2>
  <svg class="sparkline" viewBox="0 0 120 36" role="img" aria-labelledby="spark-title spark-desc">
    <title id="spark-title">Orders trend</title>
    <desc id="spark-desc">Pinned points rise from 18 to 42 orders.</desc>
    <polyline points="0,30 24,24 48,28 72,16 96,18 120,6" fill="none" stroke="#0f766e" stroke-width="4"></polyline>
  </svg>
  <p>Summary: orders increased from 18 to 42 in the pinned sample.</p>
  <p class="note">Static pinned data only; no live analytics runs.</p>
</section>
<style>
  .metric-card { display: grid; gap: 10px; max-width: 32rem; border: 1px solid #94a3b8; padding: 12px; }
  .sparkline { width: 100%; max-width: 12rem; height: 3rem; }
  .metric-card p, .note { margin: 0; }
  .note { color: #475569; }
</style>
Label the metric card.
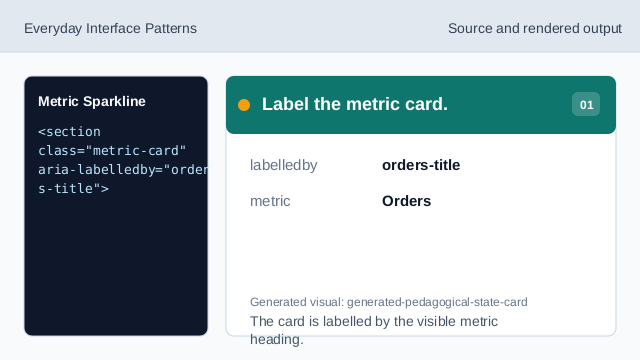
The card is labelled by the visible metric heading. Show the pinned metric value.
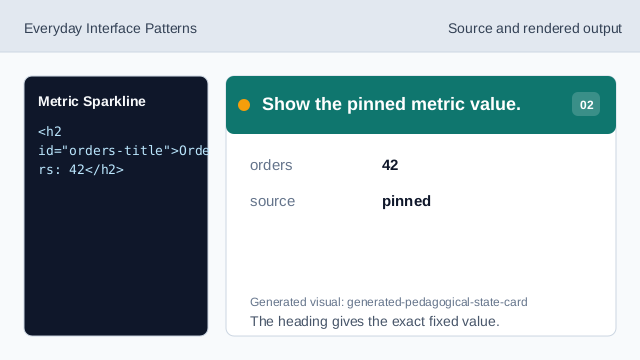
The heading gives the exact fixed value. Use inline SVG for the sparkline.
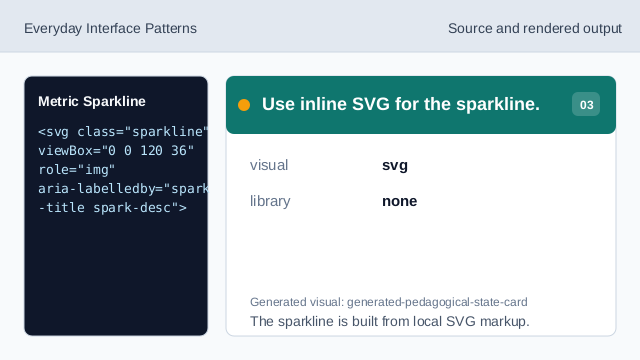
The sparkline is built from local SVG markup. Name the sparkline graphic.
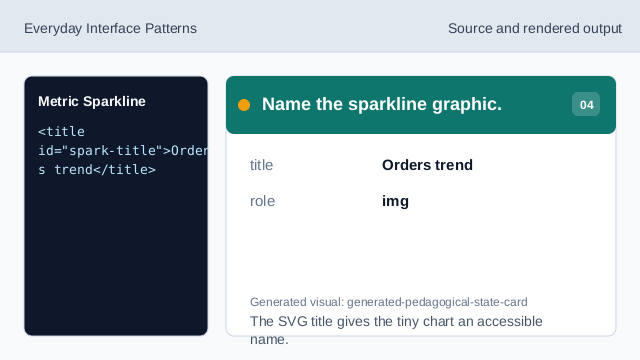
The SVG title gives the tiny chart an accessible name. Draw the fixed trend points.
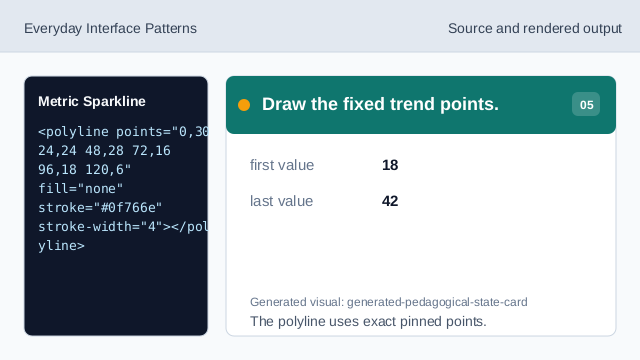
The polyline uses exact pinned points. Check the metric sparkline.
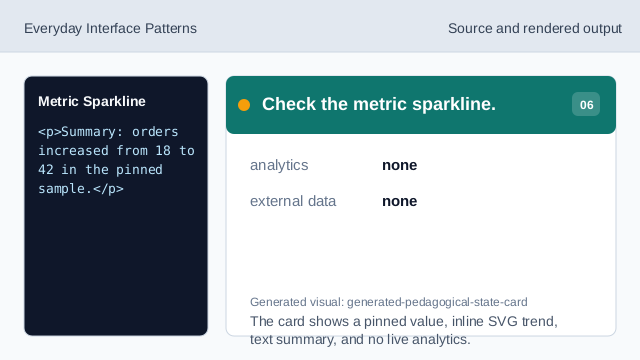
The card shows a pinned value, inline SVG trend, text summary, and no live analytics.
metric value
The visible headline gives the exact pinned value.
inline SVG
A small SVG can show a trend without a chart dependency.
text summary
The visual trend should also have a readable text summary.